Key takeaways
- Normal ranges: RA mean 0–6 mmHg; RV 15–25 systolic and 0–8 diastolic; PA 15–25 systolic, 8–15 diastolic, 10–20 mean; PCWP 6–12 mmHg.
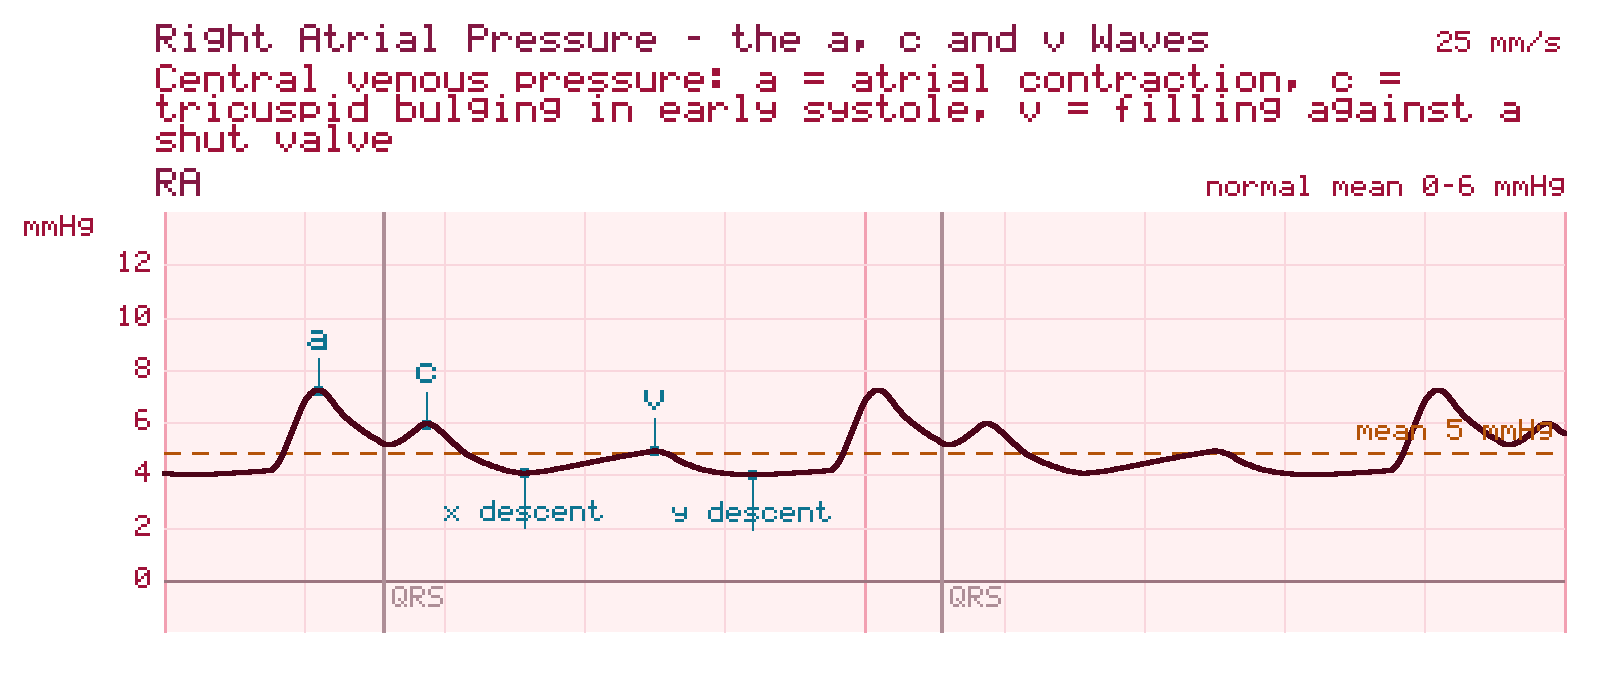
- The RA waveform has three named waves: a (atrial contraction), c (tricuspid valve bulging back during isovolumetric contraction), and v (passive filling against a closed tricuspid valve).
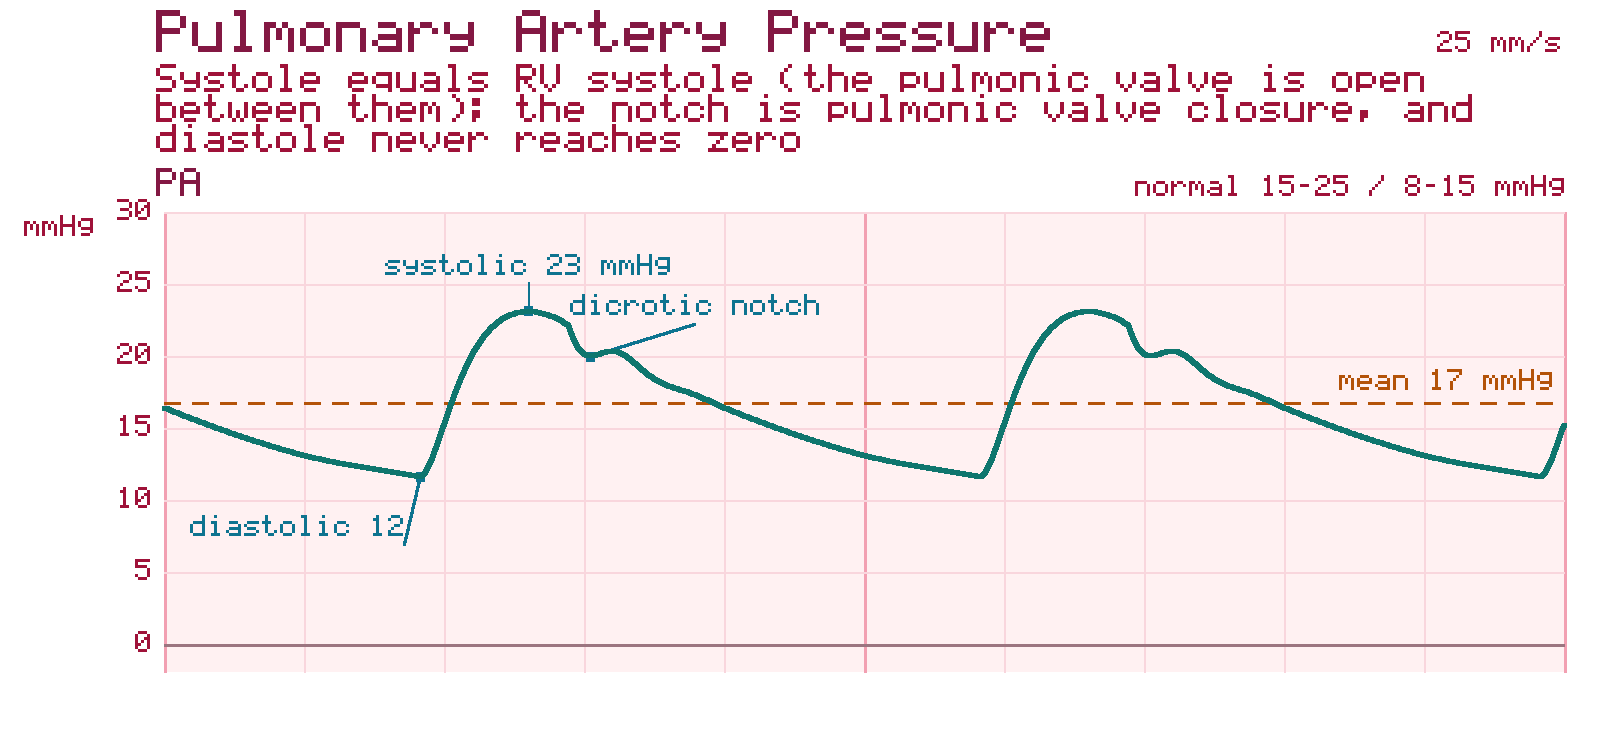
- The PA tracing is told apart from the RV by its dicrotic notch, which keeps PA diastolic pressure from falling to zero.
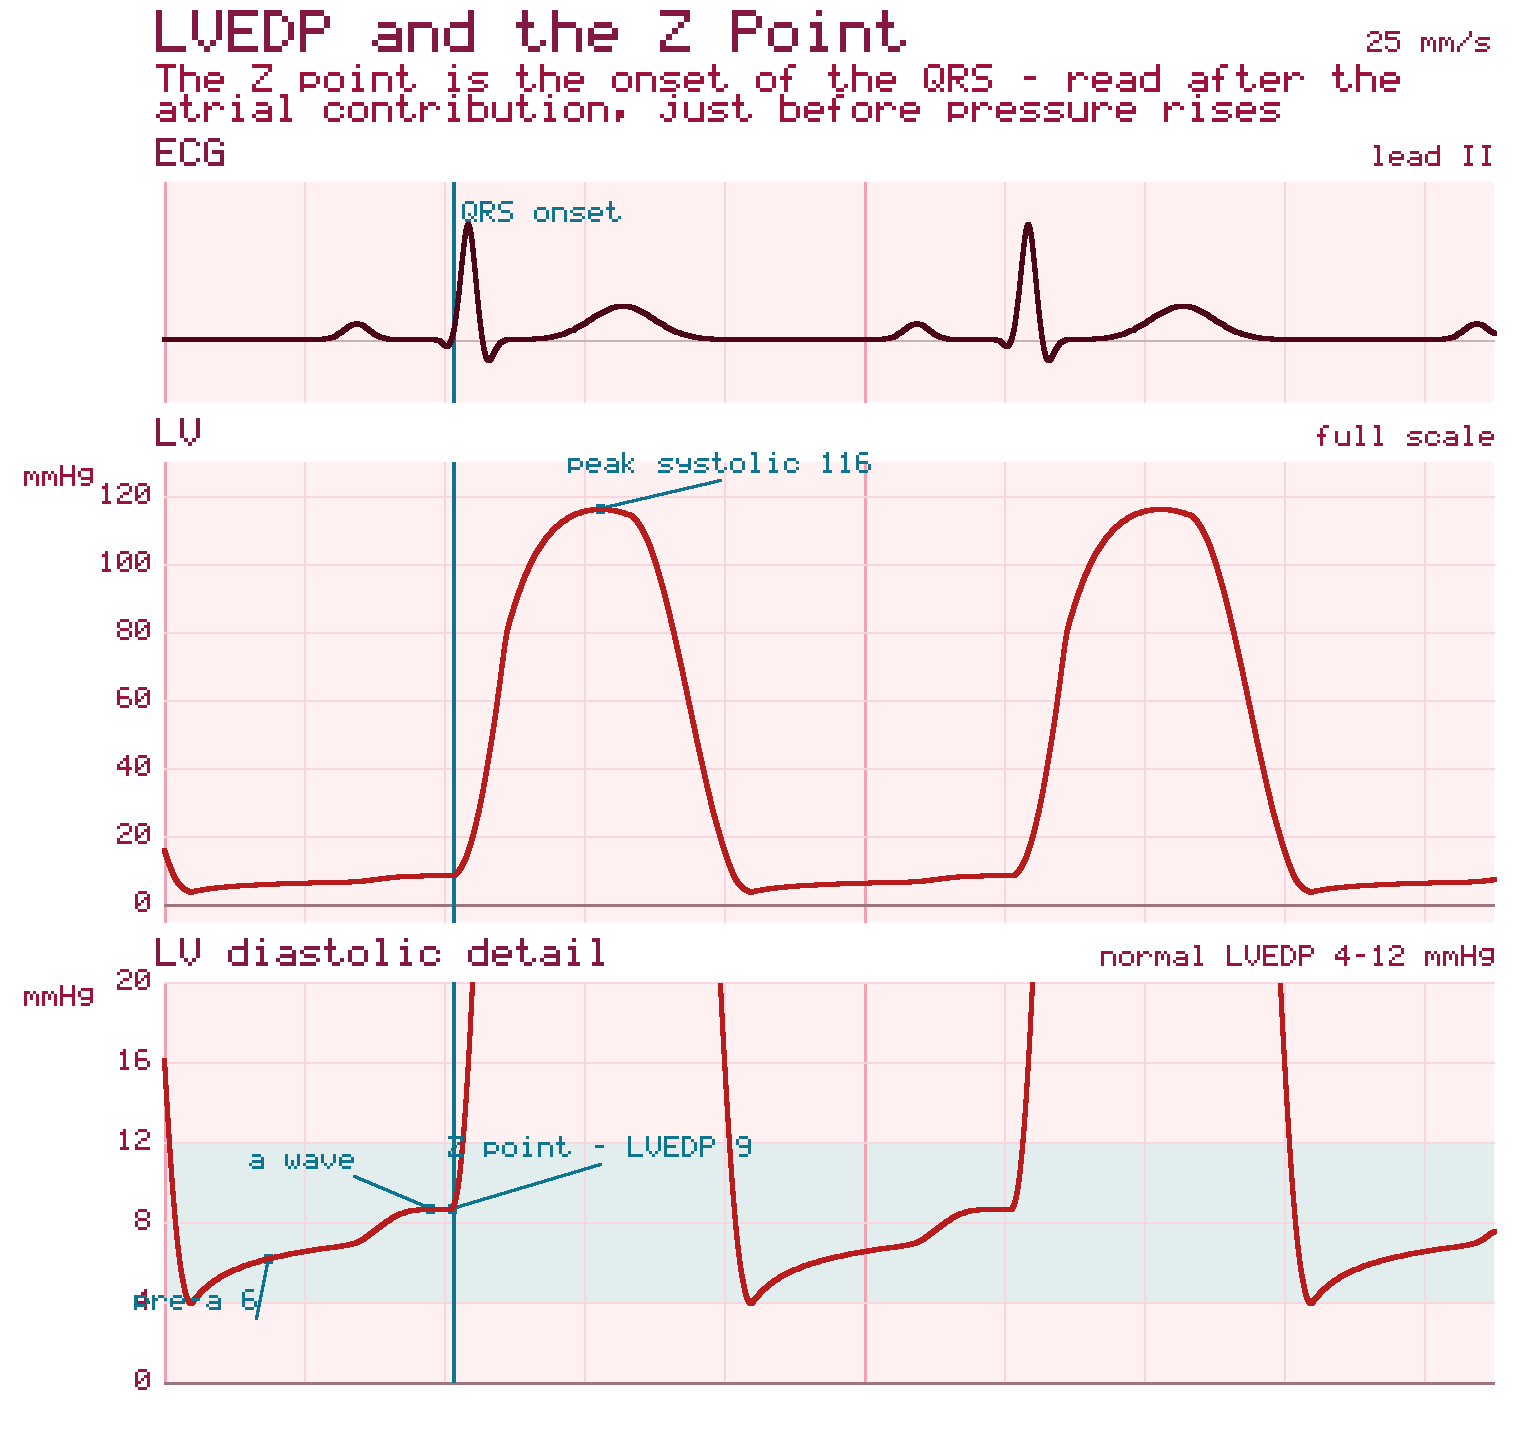
- True LVEDP is read at the z-point, at the onset of the QRS complex.
- Thermodilution cardiac output is inversely proportional to the area under the washout curve; severe TR makes it unreliable, and a left-to-right shunt overestimates it.
The short answer
Right-heart catheterization records pressure in the right atrium (normal mean 0–6 mmHg), right ventricle (15–25 systolic), pulmonary artery (15–25 systolic, 8–15 diastolic) and wedge position (6–12 mmHg). The RCIS exam tests recognising each waveform, reading LVEDP at the z-point, and knowing when thermodilution cardiac output is unreliable.
Normal right-heart pressures at a glance
These are the normal ranges given in each chamber's entry below, collected in one place. The exam expects you to recognise when a recorded value falls outside them.
| Site | Normal range |
|---|---|
| Right atrium (mean) | 0 to 6 mmHg |
| Right ventricle | 15 to 25 mmHg systolic; 0 to 8 mmHg diastolic |
| Pulmonary artery | 15 to 25 mmHg systolic; 8 to 15 mmHg diastolic; 10 to 20 mmHg mean |
| Pulmonary capillary wedge (PCWP) | 6 to 12 mmHg |
Chamber by chamber: the waveforms you have to recognise
A right-heart catheterization records pressure at each station the catheter passes through, in order: right atrium, right ventricle, pulmonary artery, then the wedge position. Each station has a waveform signature, and recognising the transition from one to the next is a core skill the exam tests.
Right Atrial Pressure (RAP)
Normal mean pressure ranges from 0 to 6 mmHg. The RA waveform is complex, reflecting mechanical events: the a-wave corresponds to active atrial contraction; the c-wave reflects the bulging of the tricuspid valve back into the atrium during isovolumetric ventricular contraction; and the v-wave represents passive atrial filling against a closed tricuspid valve during late systole.
Right Ventricular Pressure (RVP)
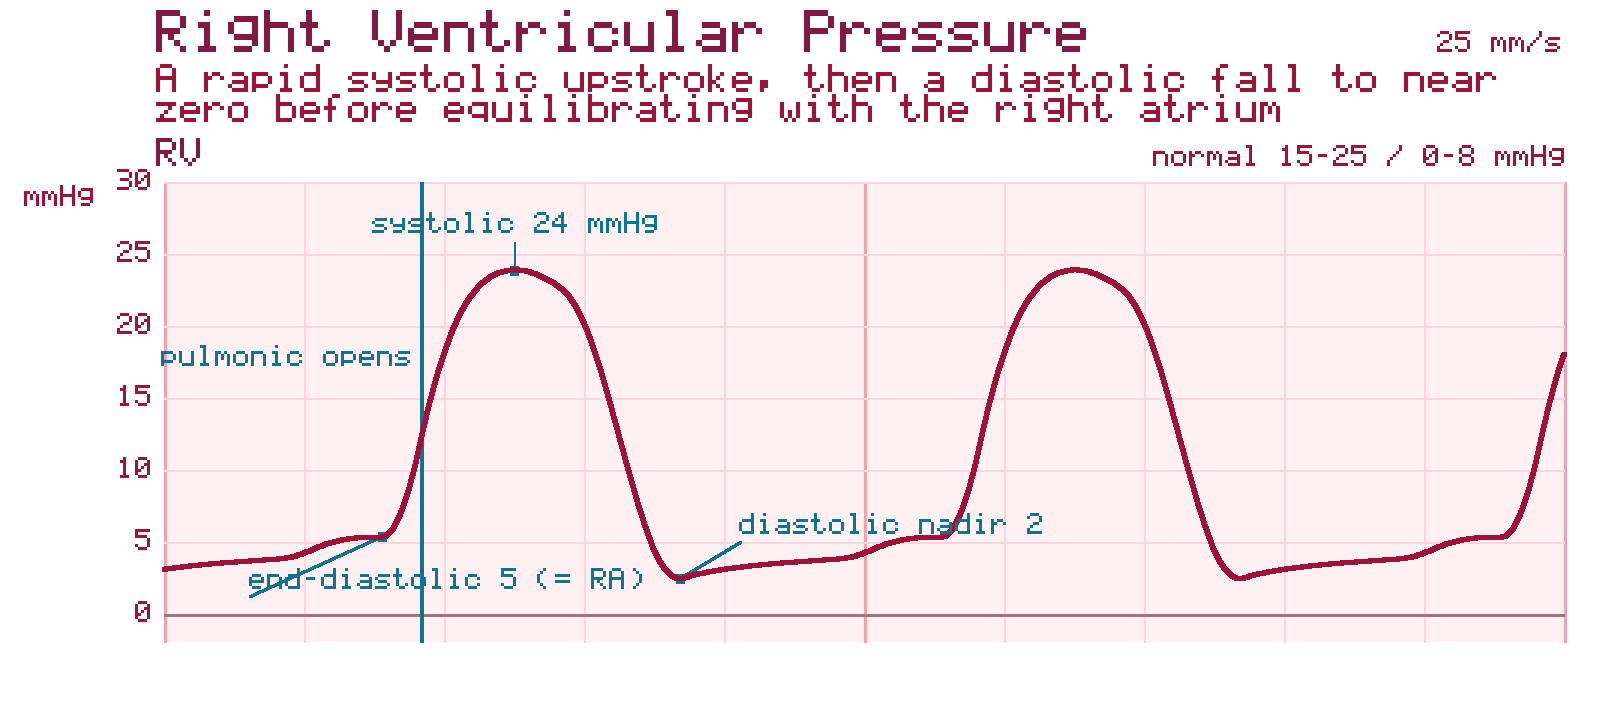
As the catheter crosses the tricuspid valve, systolic pressures rise abruptly (normally 15 to 25 mmHg). During diastole, the pressure falls rapidly to near zero before equilibrating with the right atrium (0 to 8 mmHg).
Pulmonary Artery Pressure (PAP)
Upon entering the pulmonary trunk, the systolic pressure remains equivalent to RV systole (15 to 25 mmHg). However, the sudden closure of the pulmonic valve generates a characteristic dicrotic notch, preventing the diastolic pressure from dropping to zero (normal diastolic range 8 to 15 mmHg, mean PAP 10 to 20 mmHg).
Pulmonary Capillary Wedge Pressure (PCWP)
The distal balloon is inflated with approximately 1.5 mL of air, allowing the catheter tip to safely "wedge" into a distal branch of the pulmonary artery. Inflation occludes forward flow from the right heart, creating a static, continuous column of blood between the catheter tip and the pulmonary veins. Consequently, the pressure recorded at the distal port equilibrates with, and serves as a highly accurate indirect surrogate for, left atrial pressure (LAP) and LVEDP. Normal PCWP ranges from 6 to 12 mmHg.
LVEDP, and exactly where to measure it
The wedge pressure estimates left-sided filling indirectly. On the left side of the heart, the end-diastolic pressure is read directly from the left ventricular tracing, and the measurement point matters.
Left Ventricular End-Diastolic Pressure (LVEDP)
A key hemodynamic parameter measured during diagnostic catheterization reflecting ventricular preload and diastolic function; critical for diagnosing HFpEF, valvular disease, and other structural pathologies.
Z-Point
The precise point on the left ventricular pressure tracing, corresponding to the onset of the QRS complex, at which true LVEDP is measured — marking the end of electrical diastole just before mechanical systole begins.
E/e' Ratio
An echocardiographic Tissue Doppler measurement (ratio of early mitral inflow velocity to early diastolic mitral annular velocity) used to non-invasively estimate LVEDP; a ratio <8 suggests normal filling pressures, while >14 has high specificity for elevated LVEDP.
Thermodilution cardiac output, and when it lies
Thermodilution is the cardiac output method most labs use day to day. The exam is less interested in the arithmetic than in the situations that make the number wrong.
Stewart-Hamilton Equation
The mathematical formula underlying thermodilution cardiac output measurement, deriving CO as inversely proportional to the area under the time-temperature washout curve; its accuracy degrades with tricuspid regurgitation, intracardiac shunts, or concurrent rapid fluid administration.
Tricuspid Regurgitation (TR)
Severe TR causes the cold injectate to reflux violently back into the right atrium rather than progressing linearly into the pulmonary artery. This protracts the washout phase and leads to a falsely blunted, flattened curve, which results in the unpredictable underestimation or overestimation of true CO.
Intracardiac Shunts
Left-to-right shunts (such as atrial or ventricular septal defects) introduce non-indicator-mixed, fully oxygenated blood into the right heart. This dilutes the thermal signal, steepening the curve and causing a severe overestimation of CO.
Put together: tricuspid regurgitation makes thermodilution unreliable in either direction, while a left-to-right shunt makes it read too high.
How this shows up on the RCIS exam
Diagnostic procedures are the largest domain on the RCIS blueprint, at 40% of the exam per CCI's published content outline, and hemodynamics sits at the centre of it. Expect to identify a waveform from its shape, pick the abnormal value out of a set, and explain why a cardiac output result cannot be trusted.
Test yourself on this
The free 25-question diagnostic scores you by blueprint domain, so you can see whether this topic is where your points are leaking.
Start the free diagnostic Back to the exam guide →Frequently asked
What are normal right-heart pressures?
Right atrial mean 0 to 6 mmHg; right ventricle 15 to 25 mmHg systolic and 0 to 8 mmHg diastolic; pulmonary artery 15 to 25 mmHg systolic, 8 to 15 mmHg diastolic, 10 to 20 mmHg mean; pulmonary capillary wedge 6 to 12 mmHg.
How do you tell the RV tracing from the PA tracing?
Systolic pressures are equivalent, but the PA tracing carries a dicrotic notch from pulmonic valve closure and its diastolic pressure does not fall to zero; RV diastolic pressure falls to near zero.
Where is LVEDP measured?
At the z-point: the point on the left ventricular pressure tracing corresponding to the onset of the QRS complex, just before mechanical systole begins.
Why does tricuspid regurgitation affect thermodilution cardiac output?
Severe TR refluxes the cold injectate back into the right atrium, protracting the washout and flattening the curve, which makes the calculated cardiac output unreliable in either direction.
Does a left-to-right shunt raise or lower thermodilution cardiac output?
It overestimates it. Oxygenated blood entering the right heart dilutes the thermal signal and steepens the curve.